
Economic Outlook July 2024
7/8/2024 1:00:00 PM

In a short, 18-month period, one hundred dollars invested in the S&P 500 Index (where constituents are capitalization-weighted) reached a value of $128.16. Other popular indexes like the S&P 500 Equal Weight Index (where all the stocks have equal weight) grew to only $109.28, while the S&P 600 (capitalization-weighted small cap index) grew to only $102.63.
The noticeable difference between the S&P 500 and the S&P 600 suggests the stock market favors large companies over smaller companies. Comparing the S&P 500 and the S&P 500 Equal Weight Index suggests the overall market lacks breadth, with returns concentrated in just a few large companies.
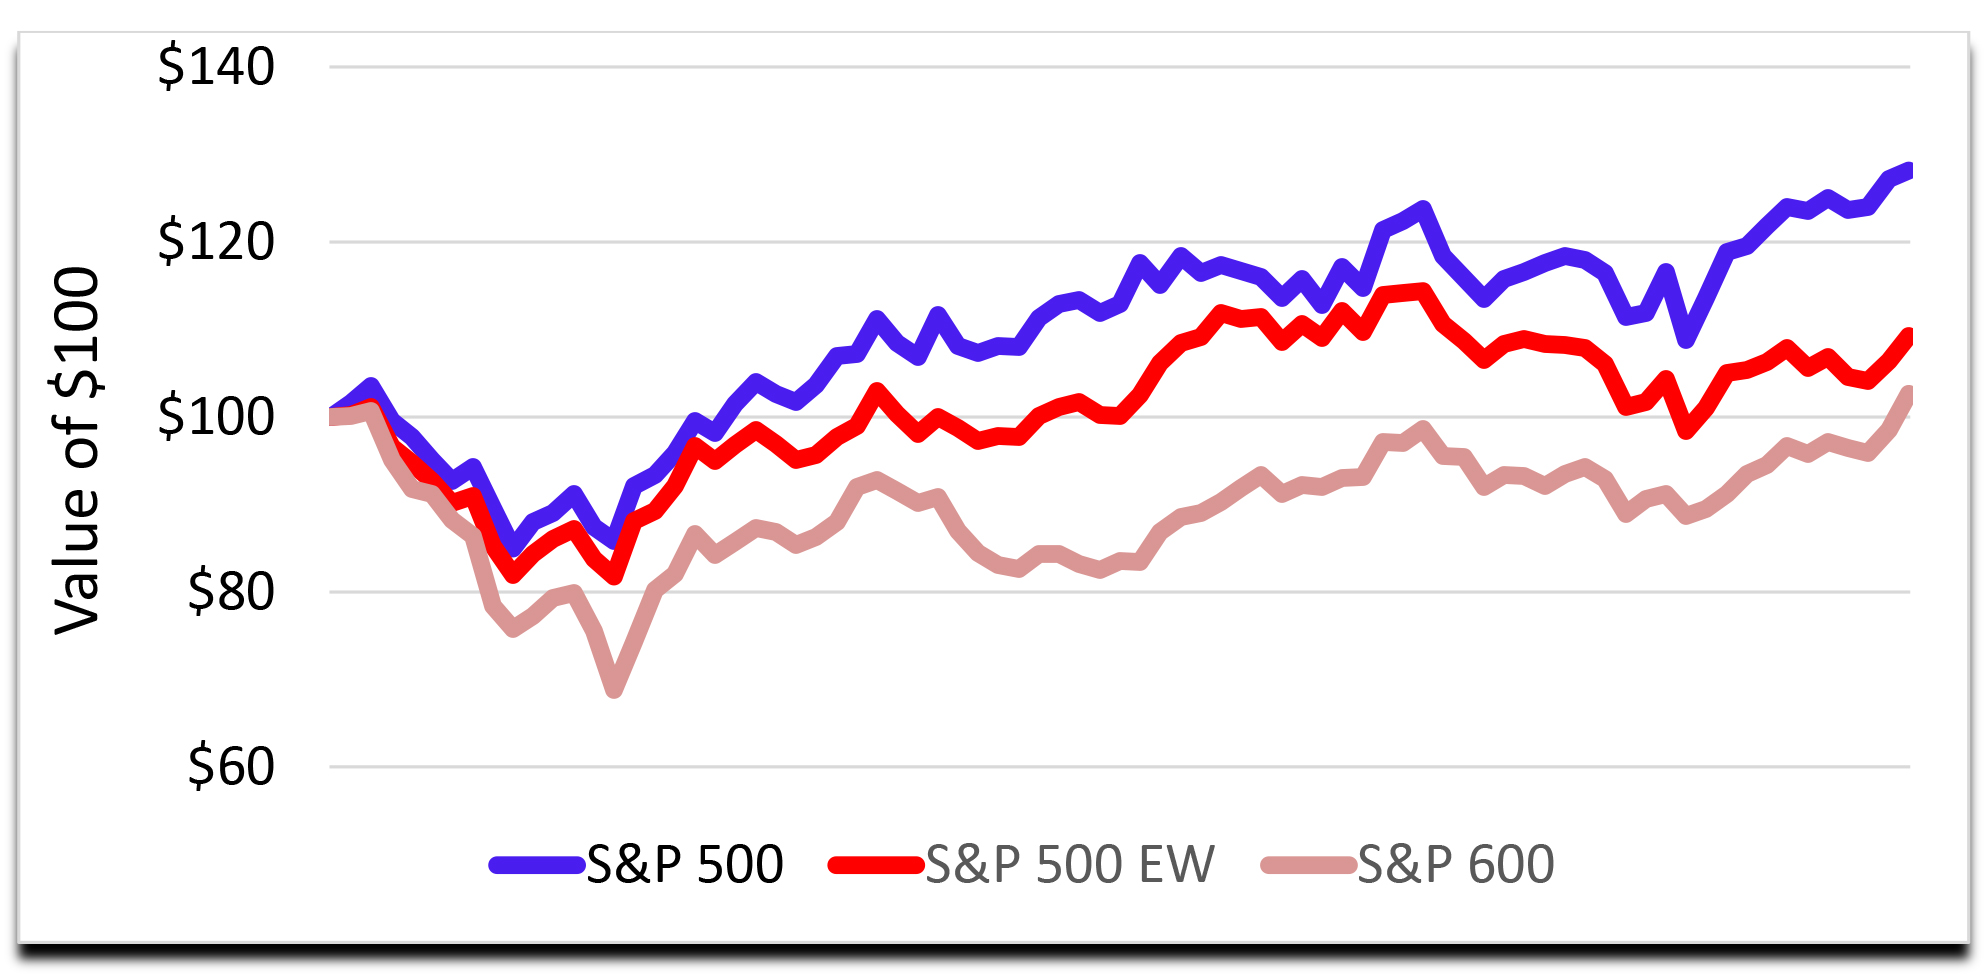
If we add in the NASDAQ 100, where large cap tech stocks are more concentrated, the $100 invested grew to a whopping $291.65 – like nothing ever seen before.
Wait a minute – you thought I was outlining the last 18 months of the market? No – these numbers show the markets from July 1, 1998, to December 31, 1999. Our most recent 18 months (from January 1, 2023, to June 30, 2024) look like the chart below:
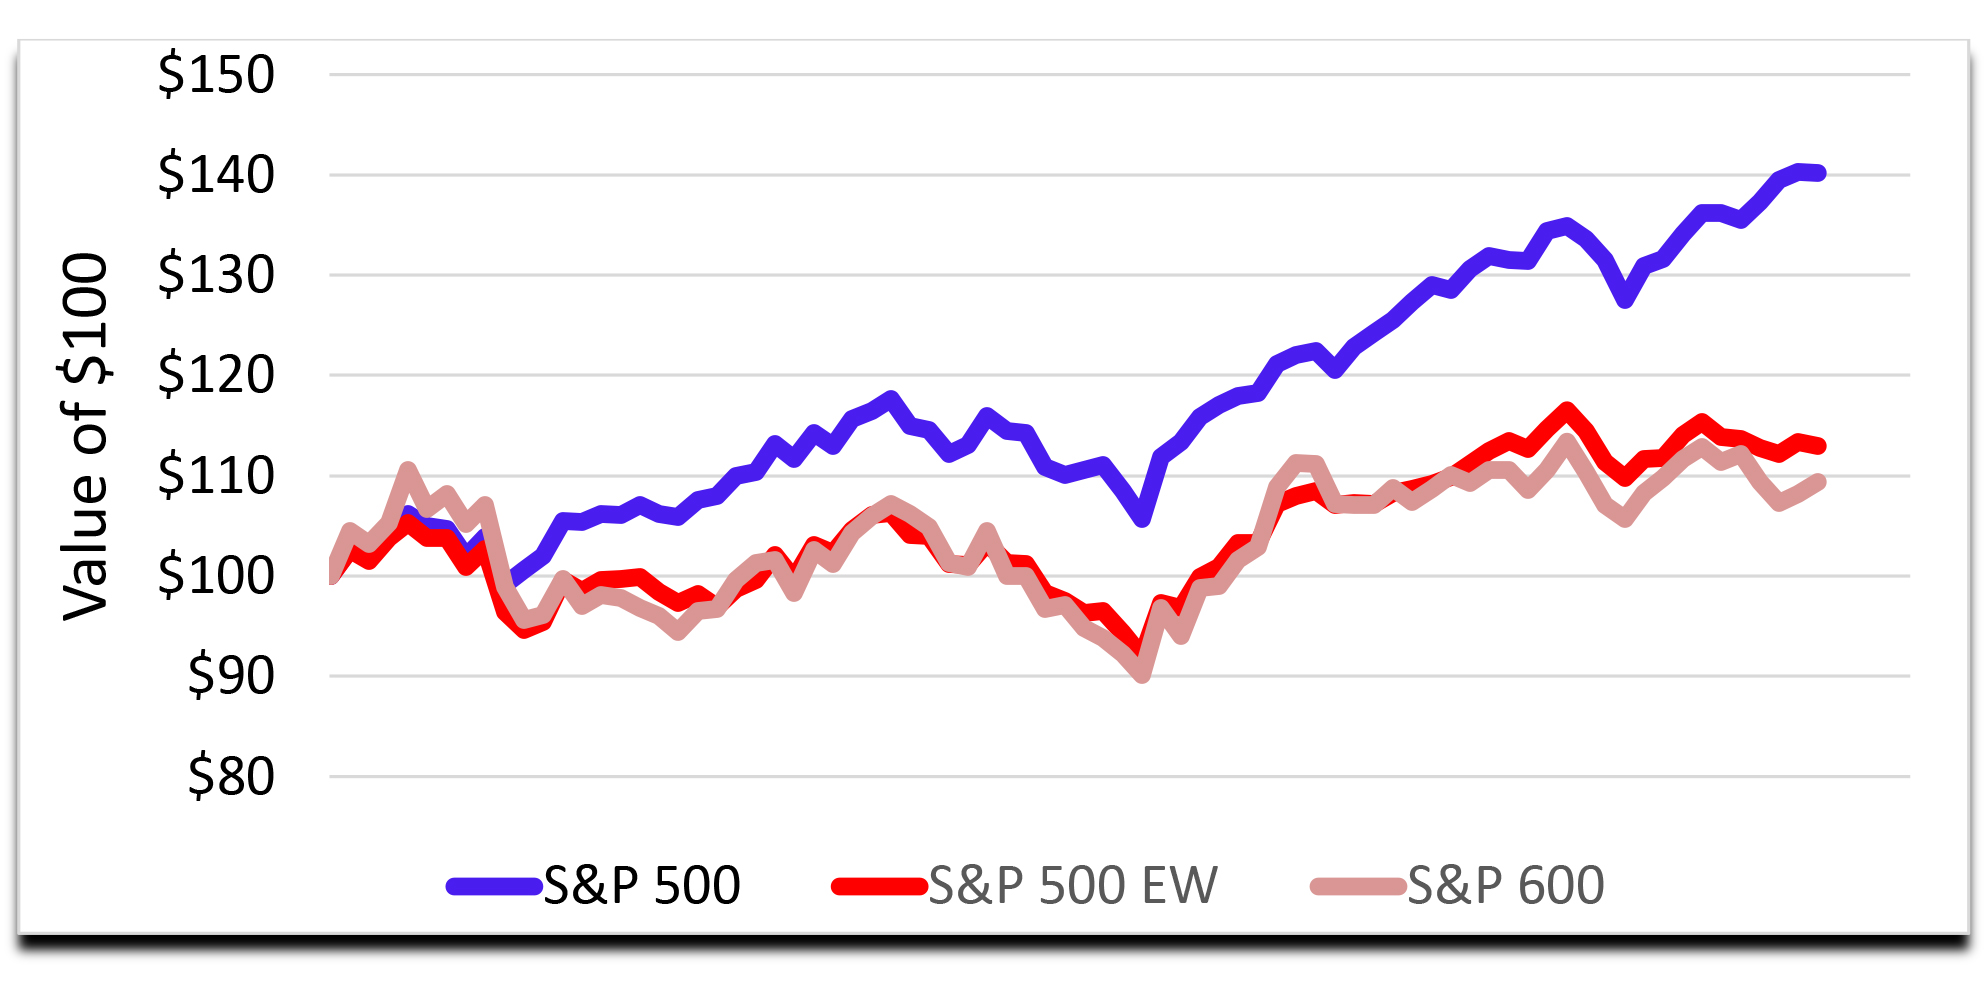
Performance in the last 18-month period for the NASDAQ 100, where tech stocks are more concentrated, saw $100 invested grow to $186.80. The biggest difference is that the NASDAQ 100 was more tech-heavy back in 1998 than it is today, and the S&P 500 was less tech-heavy back then.
In 1998, nothing was going to stop the internet revolution. Every company had to have Cisco internet routers to power delivery to the endless pool of internet users. Cisco stock went from $15 per share in July 1998 to $82 by March 2000 – and has never been that high since. Today, every company needs Nvidia chips to power the delivery of artificial intelligence to an endless pool of users. Nvidia went from $15 in January 2023 to $140 by mid-June 2024. It rests at $123 as I write. At this point, I’m not able to say accurately if it has reached its never-to-be-seen-again high.
I believe we are simply seeing human behavior through the lens of the stock market – just as we have in the past. The hard part is determining when the party is over and the lights are about go out. In stock market parlance, this is called “ringing the bell.”
After building the internet infrastructure in the late 1990s, the next phase was for users to gain access to the internet – with computer sales following a similar trajectory. It’s hard to find a comparison, because so many computer providers from the past don’t exist anymore, have been taken private or have consolidated. The next phase was monetizing the internet. Google didn’t start to take off until about 2012. Same with Amazon – and if you recall, Amazon was given a sales tax exemption to help improve adoption of the concept. Both Google and Amazon really started to grow 10 years after the internet buildout.
To summarize this story, events come and go in cycles, and our current environment is no different. Diversification in a portfolio never provides the best return, nor does it deliver the worst return. As an investor, you should base your portfolio allocation on long-term goals – rather than short-term cycles that make it next to impossible to time entries and exits with any consistency.
Thank you for your confidence in Bell!

Greg Sweeney, CFA®
SVP/Chief Investment & Economic Strategist
Products and services offered through Bell Bank Wealth Management are: Not FDIC Insured | No Bank Guarantee | May Lose Value | Not a Deposit | Not Insured by Any Federal Government Agency