


Economic Outlook November 2026
November 12, 2026

My uncle Mark used to say “You get what you inspect, not what you expect” to me 50 years ago. It’s always stuck with me. But the question I want to explore today is what happens when there is a broad range of expectations?
The last 10 years in the stock market have been exceptional. The 10-year annualized return for the S&P 500 as of the end of October was 15.42% while the NASDAQ 100 was 20.50%. Recency bias plays a big part in future expectations. To that end, surveys of individual investors indicate their expectations for stock market returns over the next 10 years are 15%, which is like the last 10 years. Surveys of institutional investment managers suggest their expectations for stock market returns over the coming decade consolidate around 8% to 9%. Compare these to a market indicator like the Case-Shiller CAPE (Cyclically Adjusted Price Earnings) ratio that expects stock market real returns for the coming decade to be flat, which means somewhere around zero after inflation. I should note that the only indicator on this list that has won a Nobel Prize is the CAPE ratio.
Year | 10-Year Rolling Annual Return | 20-Year Rolling Annual Return | 30-Year Rolling Annual Return |
2018 | 13.10% | 5.60% | 8.90% |
2019 | 13.50% | 6.10% | 9.81% |
2020 | 13.90% | 7.60% | 10.61% |
2021 | 16.30% | 9.50% | 10.56% |
2022 | 12.50% | 9.80% | 9.55% |
2023 | 12.00% | 9.70% | 10.07% |
2024 | 13.10% | 10.30% | 10.87% |
2025 | 14.80% | 10.90% | 10.30% |
Returns gravitate to the mean (average). Over a lifetime investment cycle, investors that remain invested tend to have a return close to the long-term average. The table below of rolling S&P 500 returns for 10, 20 and 30 years demonstrates this. The CAPE ratio is near its historical highs, which is consistent with muted real returns over the coming decade. This is a meaningful step down from expectations. Sure, this is just like any other indicator. It lacks predictable timing and it’s a forecast. There is also the chance that this time could be different.
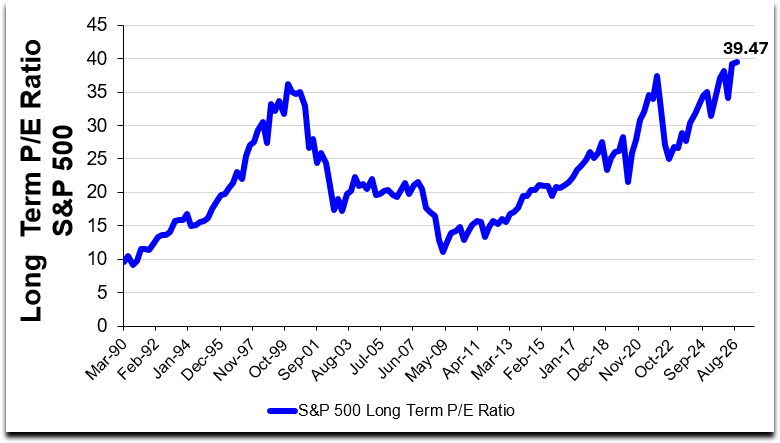
My sense is when things get to this level, it's an indication to review portfolio allocations. Have strong stock earnings led to a concentration in stocks in your portfolio? If so, does that concentration fit your risk tolerance and income expectations?
Last month's Outlook highlighted the fact that bonds are again providing an interest rate level that has not been available for nearly 20 years.
I am a believer that bond and stock returns will gravitate to long-term averages. With stocks a noticeable amount away from their average and bonds much closer to average, it is a reasonable time to take steps to properly align your portfolio allocations to better fit your risk and return profiles if those allocations have drifted away from their intended range.
Thank you for your business and confidence in Bell!
Greg Sweeney is the chief investment and economic strategist at Bell Institutional Investment Management. He guides the investment strategy, and this outlook is his perspective on the latest market trends and what they could mean for investors. Any views, strategies or products discussed in this article may not be appropriate or suitable for all individuals and are subject to risks.

Greg Sweeney, CFA®
SVP/Chief Investment & Economic Strategist
Products and services offered through Bell Bank Wealth Management are: Not FDIC Insured | No Bank Guarantee | May Lose Value | Not A Deposit | Not Insured by Any Federal Government Agency.